Spendify
Personal finance dashboard for tracking income, expenses, liabilities, and net worth across accounts.
Overview
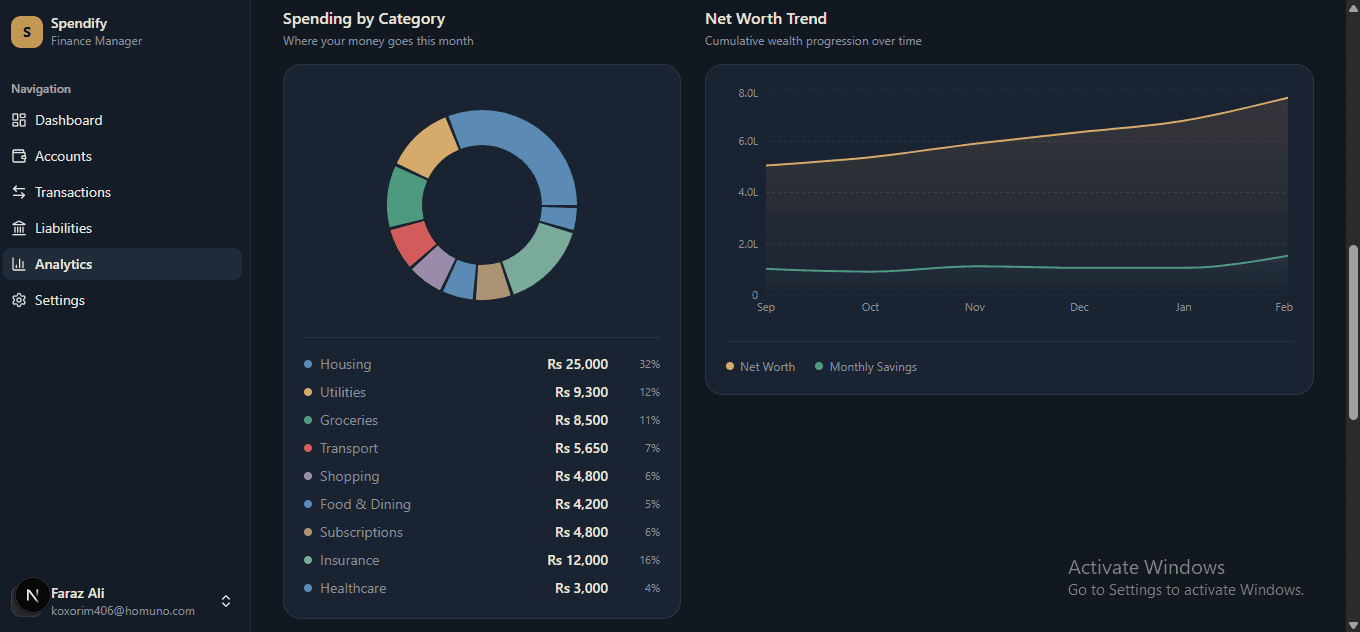
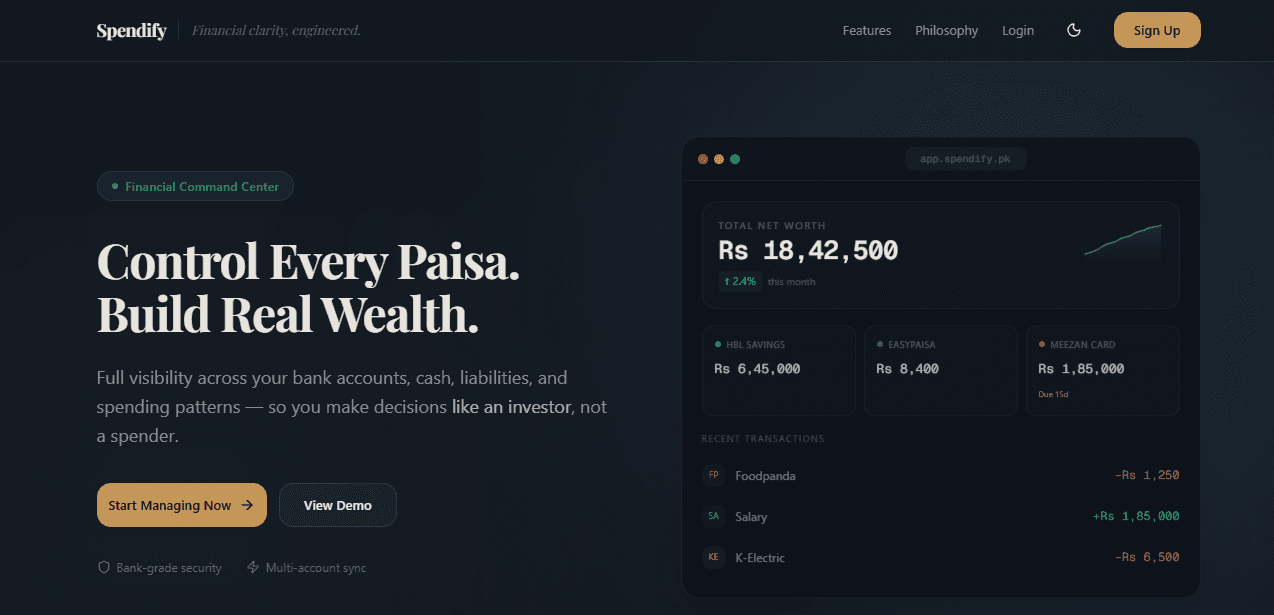
Most finance apps either oversimplify or overwhelm. Spendify is built around one question: where is your money actually going? Multi-account tracking, liability visibility, and net worth trending, without needing financial expertise to navigate.
The design prioritizes trust and readability: complex financial data presented with clear hierarchy, without visual noise.
Goal
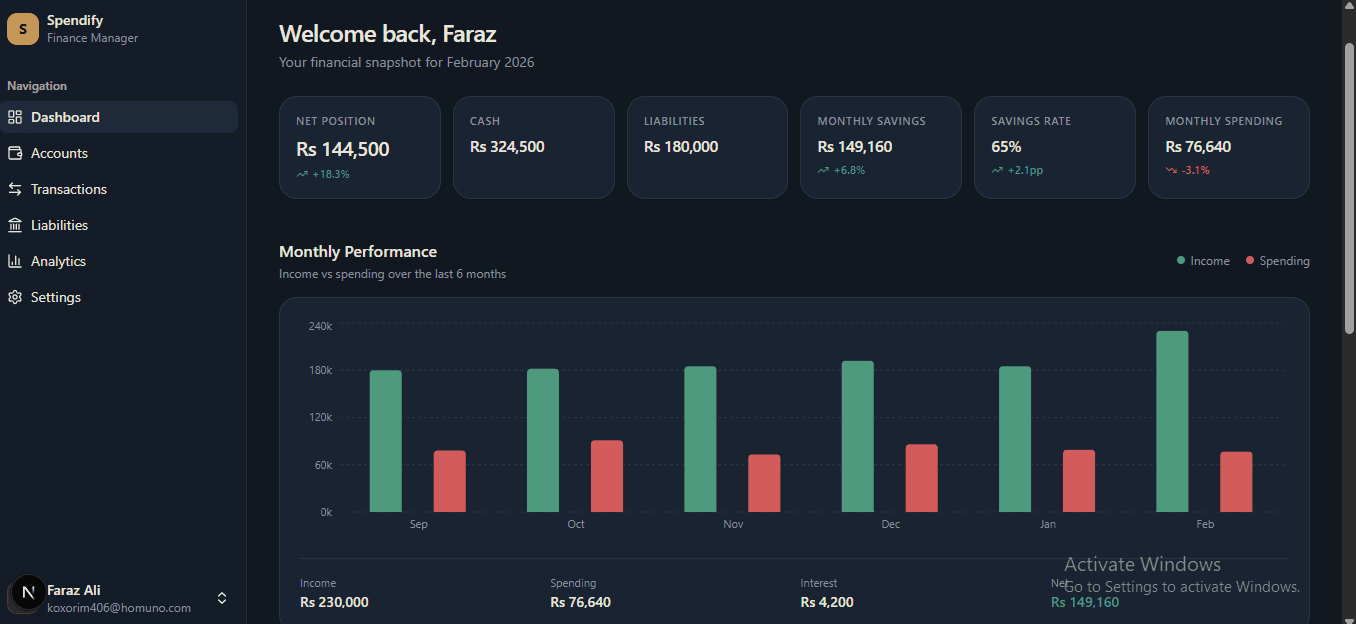
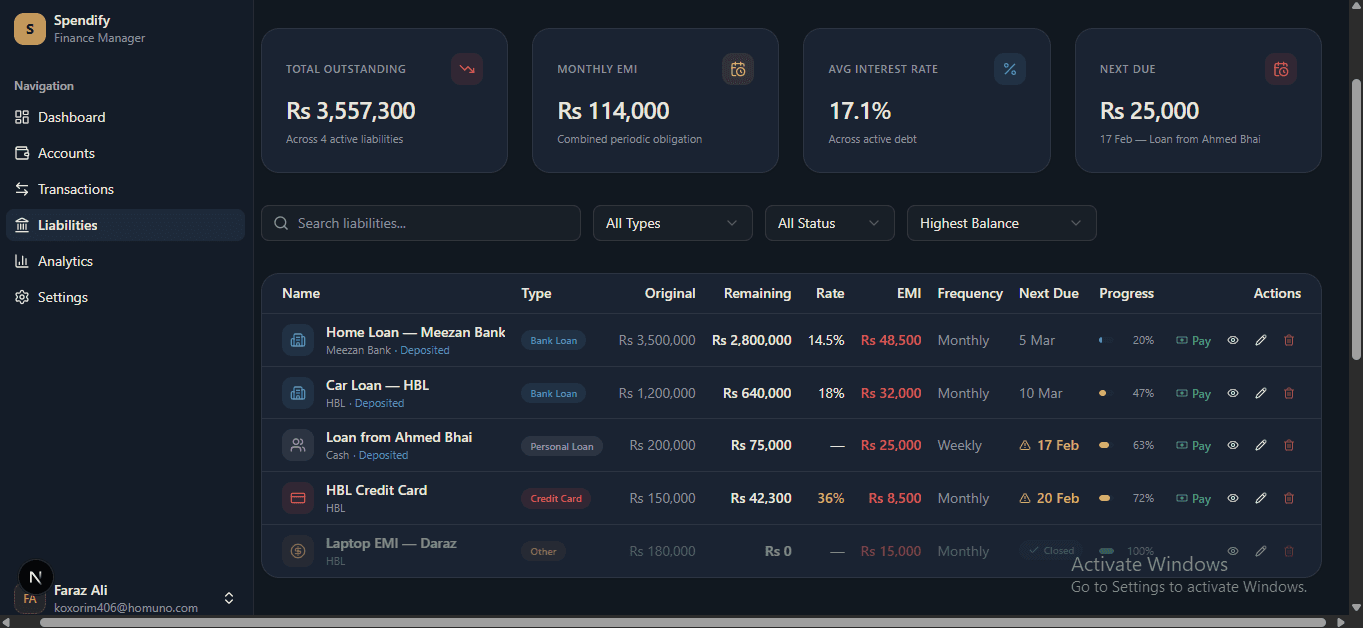
Financial data has real complexity. The goal was to build progressive disclosure into the information architecture: account-level summaries at a glance, drill-down when the details matter, without visual overwhelm at either level.
- Simplify financial tracking into one centralized view
- Create strong visual hierarchy for better decision-making
- Build a modular dashboard architecture
- Design for trust: clear data, consistent layout, no visual clutter
- Develop a reusable component system for future feature expansion
Outcome
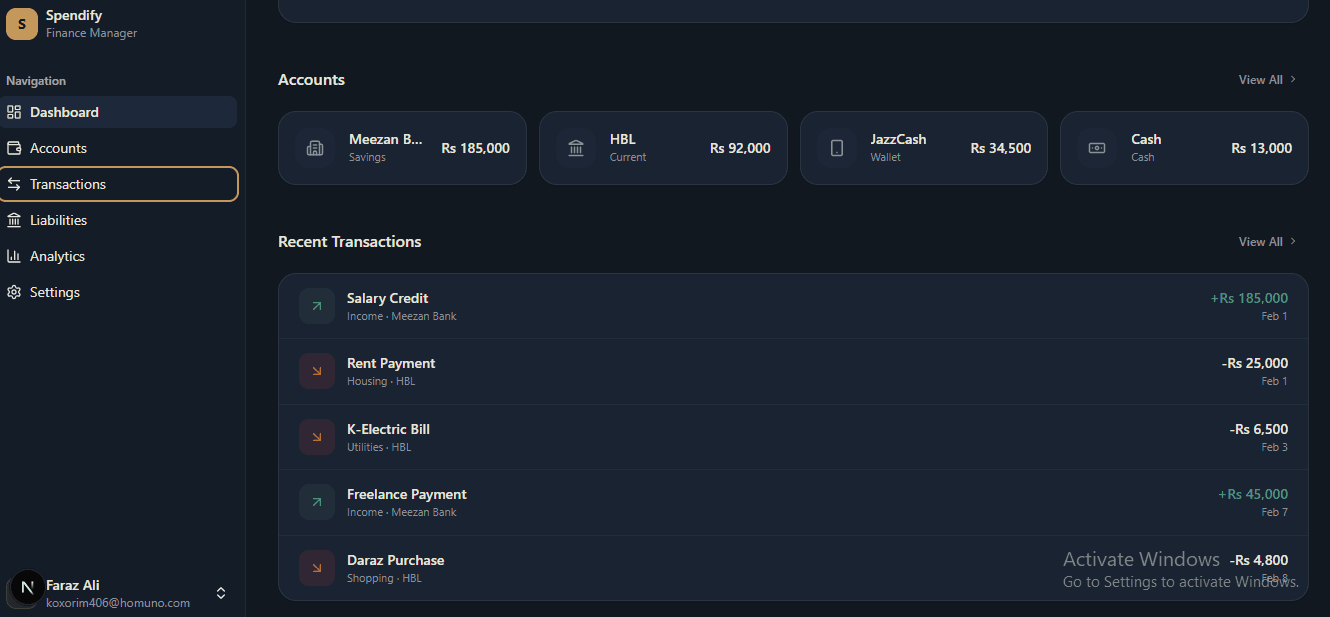
Built with modular components and a structured layout grid. Each section surfaces one financial concern clearly, without competing for attention with the rest of the dashboard.
- A responsive finance dashboard with clear data summaries
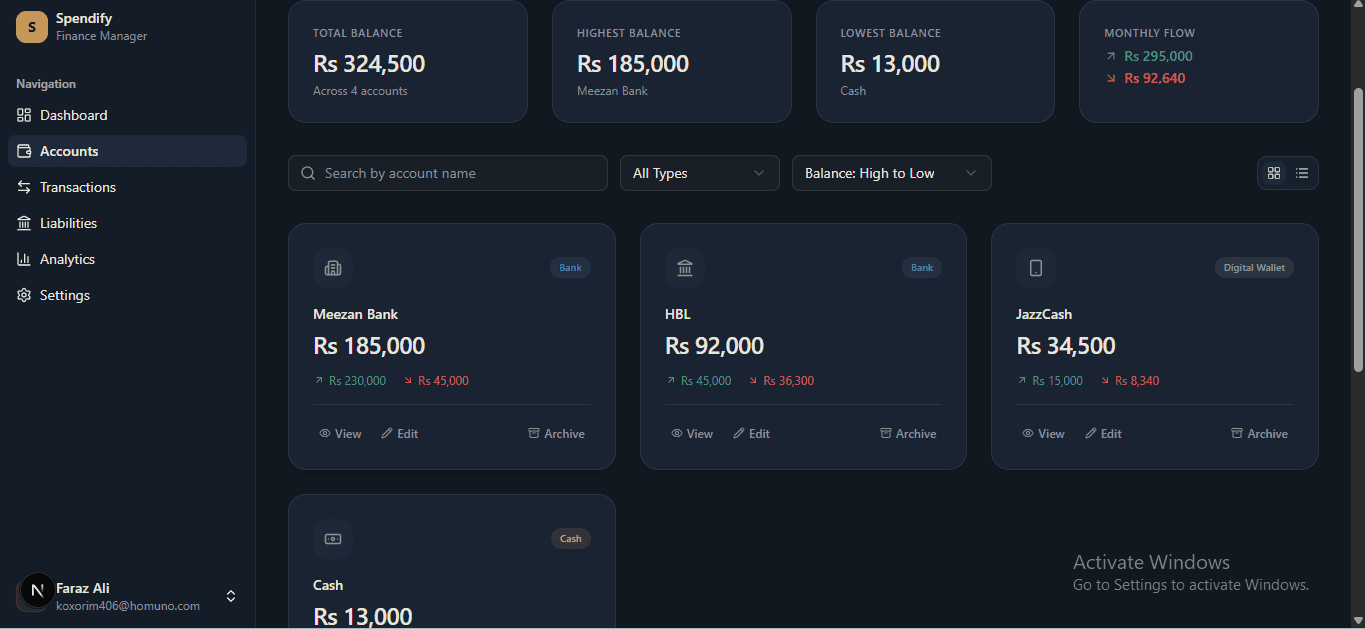
- Multi-account support and categorized transactions
- Clean, finance-grade visual design with strong hierarchy
- Optimized performance using Next.js App Router
- Backend integration with Supabase for dynamic data handling
Tech Stack
 Next.js
 TypeScript
 Supabase
- PostgreSQL
- Shadcn UI
 Tailwind CSS
Technical Decisions
Account-level transaction linking over flat categorization
Transactions needed to be attributable to specific accounts (Meezan, HBL, JazzCash, Cash), not just globally categorized. A flat transaction log would have made per-account balance calculations expensive. The relational structure (accounts → transactions) made per-account summaries, filters, and net worth calculations straightforward.
Supabase Row Level Security for data isolation
Financial data is the most sensitive category. RLS policies at the database level meant the API layer couldn't accidentally expose another user's data even with a misconfigured query. No application-level filter logic required; the isolation is enforced at the storage layer.
Shadcn UI for data components
Financial dashboards need information-dense tables and charts without visual clutter. Shadcn's unstyled primitives allowed full control over data density and layout without fighting a component library's visual opinions on spacing and color.
4
Account types
3
Chart types
6+
Transaction categories
RLS
Data isolation